This article covers the following topics:
- Overview
- Project Site Information
- Configure Site Location Symbology by Status
- Usable Area Calculation for Single Project Site
- Column Options, Export, and Filtering Functionality
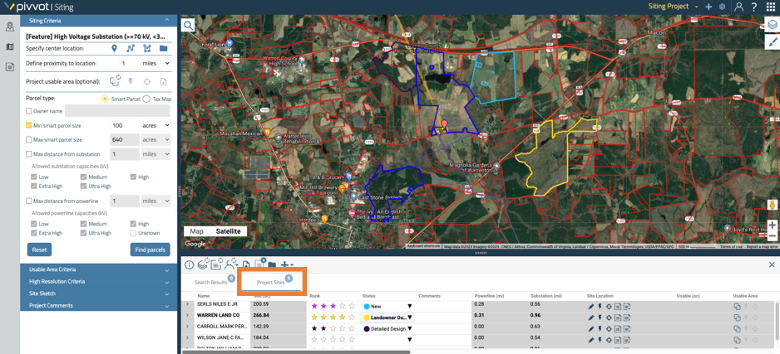
Overview of Project Sites Tab
The project sites tab contains information regarding all the sites that have been added to your project, either from the search results tab, by manually adding sites, or by uploading custom sites. The columns in the project sites tab can be categorized into two groups; columns related to site information, and columns related to usable area.
Project Site Information
The first several columns in the project sites tab provide general information about each site in the project. For each site record you can see information such as site name, the site size, site rank, status, and any comments associated with the site.
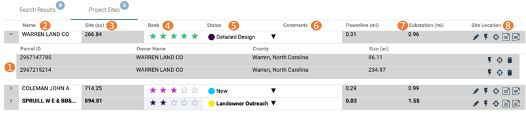
These columns include the following:
| 1. Parcels | By expanding the site, you can see all the individual tax map parcels that make up that particular site. For tax map parcels, this will only include one parcel, but for smart parcels or custom sites, it may include several tax map parcels. |
| 2. Name | This column lists the name of the site. For sites added either via the Search Results tab or the Add Sites tool, the default name of the site is the landowner’s name. By double-clicking within the cell, you can edit the site name. |
| 3. Size (ac) | Total acreage of the site. |
|
4. Rank |
You can assign a 1 to 5 rank to each site by double-clicking on the desired rank. |
|
5. Status |
This is a drop-down field that can be selected to indicate the current status of the site. These options can be configured for each account. |
|
6. Comments |
This field can be used to add any relevant comments about the site. |
|
7. Powerline (mi) and Substation (mi) |
These two columns list the distance to the nearest powerline and substation, respectively, to the site. |
| 8. Site Location |
This column includes several tools to visualize and get information about a site. From left to right, the icons allow you to edit a site, flash the site location, zoom to the site, generate a Siting Constraint report or download a Permitting report of the site. For more information about editing sites, please see this Help Center article. For more information about the Siting Constraint and Permitting reports, please see this Help Center article. |
Configure Site Location Symbology by Status or Rank
Site location boundary symbology can be associated with the site status or the rank column. You can choose whether to use status or rank to color code your sites at the account level. The status options can be configured and customized for each account. For more information and assistance with customizing these options, please contact support@pivvot.com.
Set and Color Code by Status
To set the status, double click on the status column and choose a status from the dropdown list.

![]()

Note: Customization of site status values and color must be performed by a member of the Pivvot Customer Success team or the account manager. Please reach out to support@pivvot.com for assistance.
Filter Project Sites by Status on the Map
You can limit your project sites by status by selecting the status of the sites you would like to see in the list of project sites and on the map. Hover over the top of the status column, click on the hamburger icon and then the filter icon. Check or uncheck the status checkboxes to customize which sites appear on the map.

![]()

Set and Color Code by Rank
If this feature is enabled, you can choose to color code your sites by rank at the account level. To set the rank for each site, double click on the star level you would like to rank the site.

![]()

Usable Area Column
Note: Before calculating the usable area of your project sites, adjust the project constraint criteria to meet your project’s needs. To adjust your constraint criteria, visit the Usable Area Criteria article.
Usable Area Calculation for Single Project Site
The usable area column contains three tools. From left to right, the first icon will calculate the usable area for the site, flash the usable area in the site, zoom to the usable area of the site on the map.
Once the calculation is complete, the Usable (ac) total will populate in the usable (ac) column located to the left of the usable area column.
![]()

Constraint Columns
The constraint columns show the percent of impact on the usable area calculation. These percent values represent the amount of impact the constraint has on the project site and are located to the right of the usable area column. Flash the represented area or zoom to it by hovering over the constraint record and selecting the desired tool.
![]()

Removing a Project Site from the Projects Tab
To remove a project site from a project, use the remove from project tool located to the far right of the project site record.
Project Site Tab Column Options, Export, and Filtering Functionality
Right clicking on a record in the table, will open the options menu. This menu contains all record functionality as well as the option to export all project site information to Excel or CSV.
![]()

Filtering
To filter any column, hover over the column name until the hamburger icon appears to the right of the column name. Select the hamburger icon to open the filter menu. Choose the left option to change the table’s format. Choose the center filter option to begin filtering the data in the column. Choose the right option to edit what columns are shown in the table.
Related articles: