This article covers the following topics:
Overview of Siting Dashboard
The siting dashboard is a robust tool designed to manage your Siting portfolio effectively. With its user-friendly interface, it provides a comprehensive overview of your projects, including their geographic location and crucial metrics such as total usable area and estimated megawatts. In this article, we'll explore the two essential components of the Siting Dashboard and how to use them to maximize your portfolio management efforts.
The project map is a visual representation of your portfolio's geographic location. It displays all your projects as pins on the map, enabling you to quickly see where your projects are located.
The reports section provides valuable metrics and insights into your portfolio's performance. This section includes critical metrics such as total usable area, estimated megawatts, and site status, which provides an understanding of a site's development status.
You can access this information at the user or account level, depending on your access, allowing you to customize your dashboard and see only the information that's relevant to you.
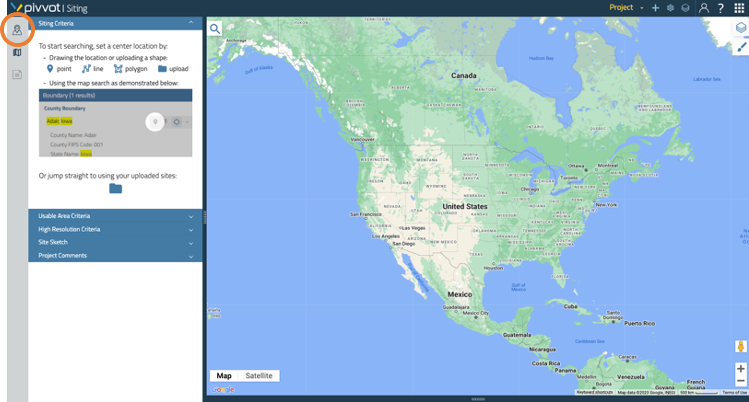
To access the siting dashboard, click on the dashboard icon located on the left sidebar of your screen.
Project Map
The project map is a powerful tool in the Dashboard that allows you to visualize and interact with project locations. In this article, we'll show you how to navigate the project map and get the most out of its features.
Project Map View
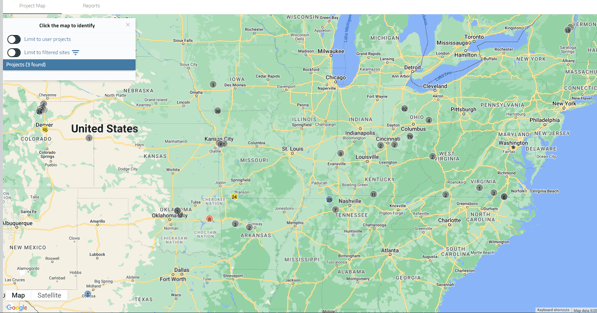
When you open the dashboard, you'll be directed to the project map view. The project map displays all project locations, color coded by the type of project (none, solar, wind, battery energy storage system, hybrid, other), and the number of project sites.
note: Type of project can be set and/or changed within Project Settings.
Limit to either the user's projects or the projects for the entire account by toggling the Limit to user projects button.
Interactive Project Locations
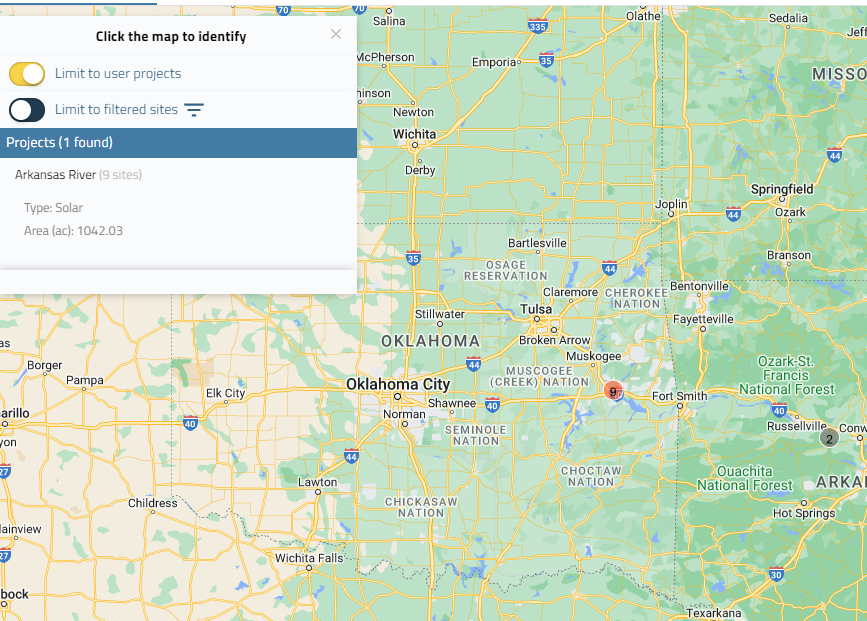
Click on the project location circle and the search panel will display the total area (in acres) of the project. You can continue to zoom in to view the different sites within the project.
Interactive Project Sites
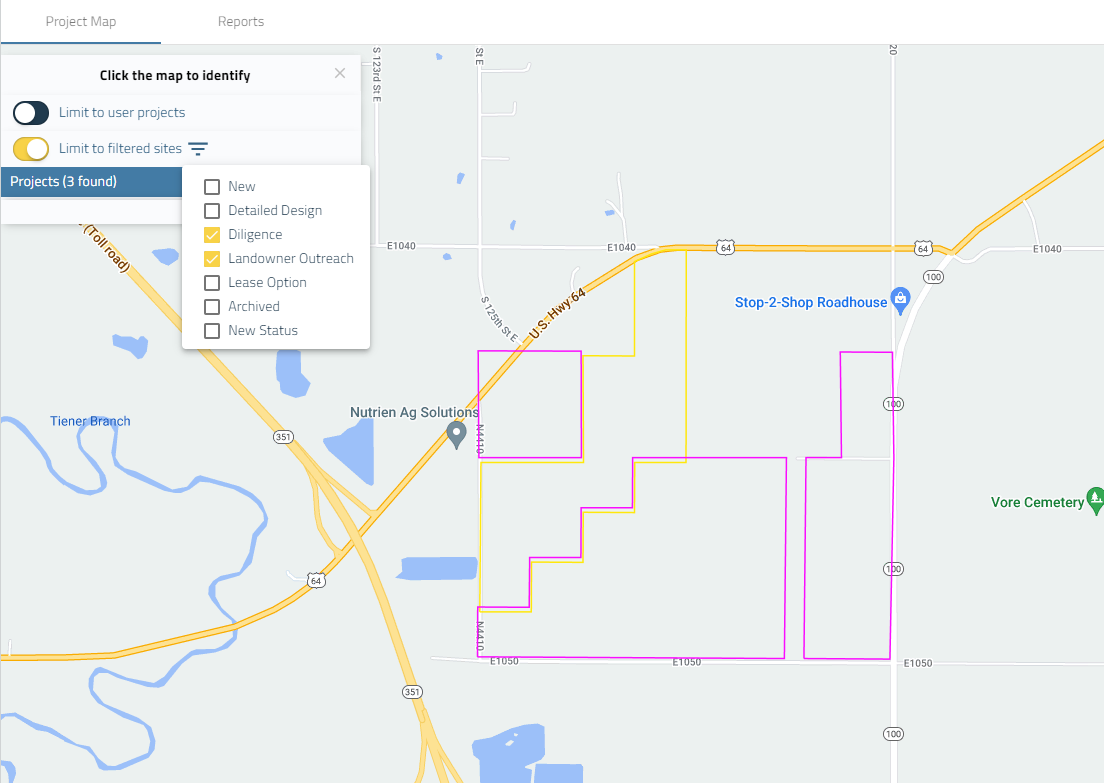
To view the sites within a project, select a project location on the map and zoom in. The different sites will start to appear on the map.
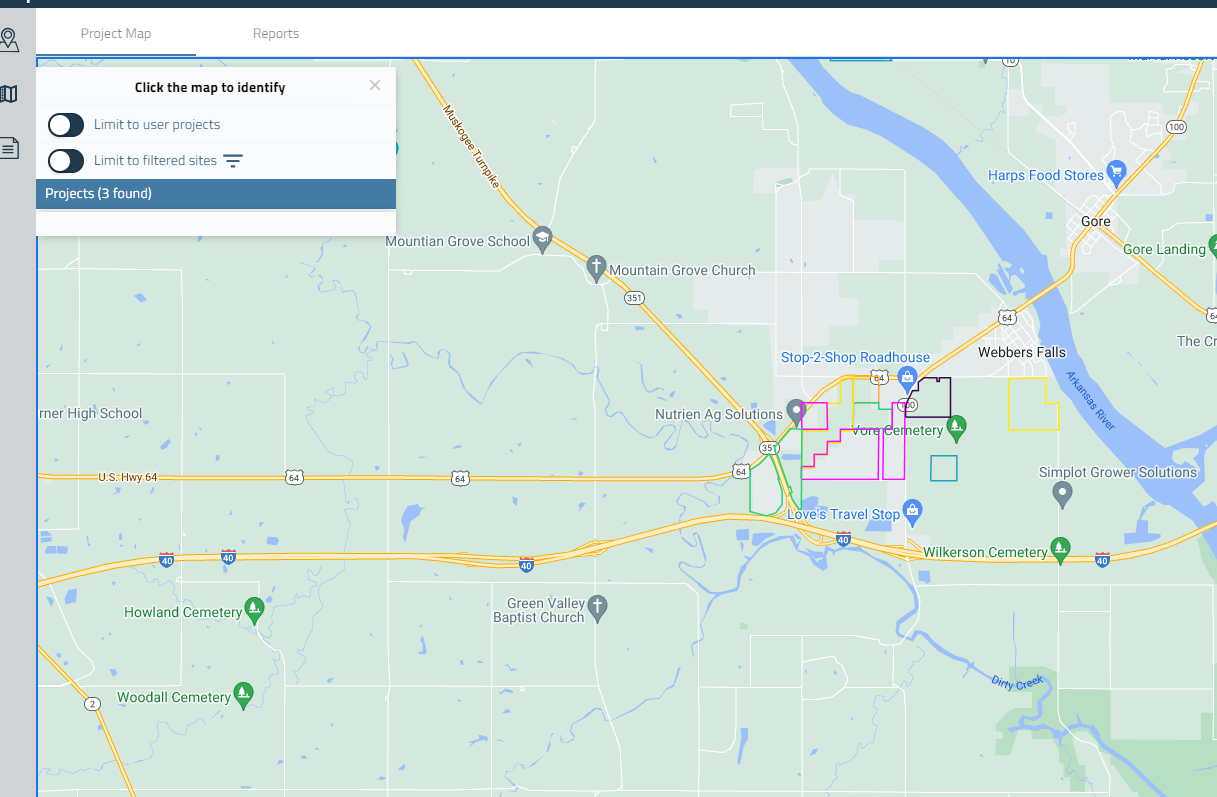
To choose which statuses you want to view on the map, enable the "Limit to filtered sites" button. This allows you to select the specific status or statuses you're interested in, and only those selected statuses will be displayed on the map.
note: "Limit to filtered sites" will only show for accounts where the Account Admin has enabled that setting. Account Admins can enable this via the Siting Console.
Site Navigation
Once you've selected a site, hover over the site name in the search panel to reveal the icon: "Navigate to Asset."
The "Navigate to Asset" icon will bring you to your project in the main Siting map. This is useful if you want to view more detailed information about the site or make changes to it.
Reports in Siting Dashboard
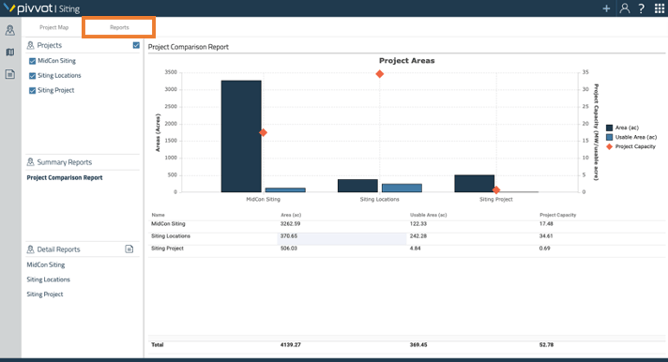
The Reports tab in the Siting Dashboard can provide valuable insights for project managers and stakeholders. Located to the right of the project map tab, the Reports tab includes both Summary Reports and Detail Reports for the project locations in the user's account or at the account level, depending on the user's role. By accessing this feature, users can view reports for a single project or compare multiple projects, making it easier to track progress and identify areas for improvement. In this section, we'll walk through the steps to access and use the Reports section of the Siting Dashboard.
Summary Report
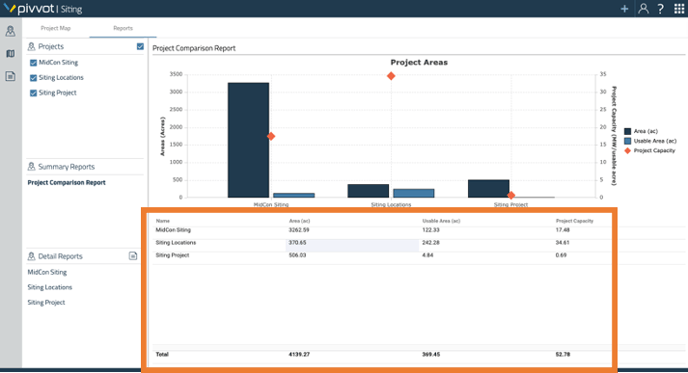
Summary Report section provides valuable insights into important metrics, such as project areas, acreage, usable acres, and project capacity. Using the features in the Summary Report section, you can easily compare projects, filter data, sort columns, and download data in Excel or CSV format.
This section explains how to use the features in the Summary Report section to compare projects and as well as other features that will help reveal information about your Siting portfolio.
Comparing Projects
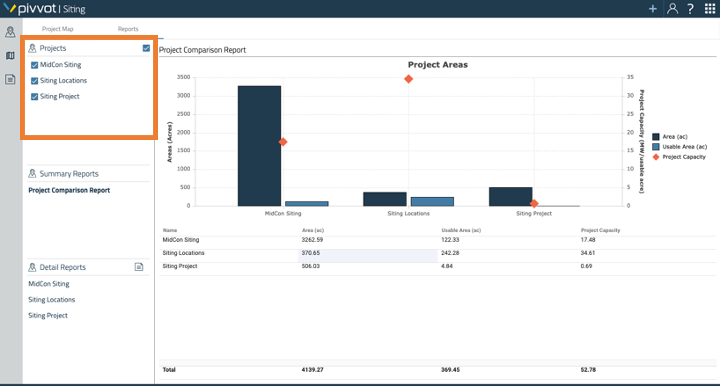
To compare projects, select any number of projects under the Projects category. Once selected, the Project Areas graph and table will populate.

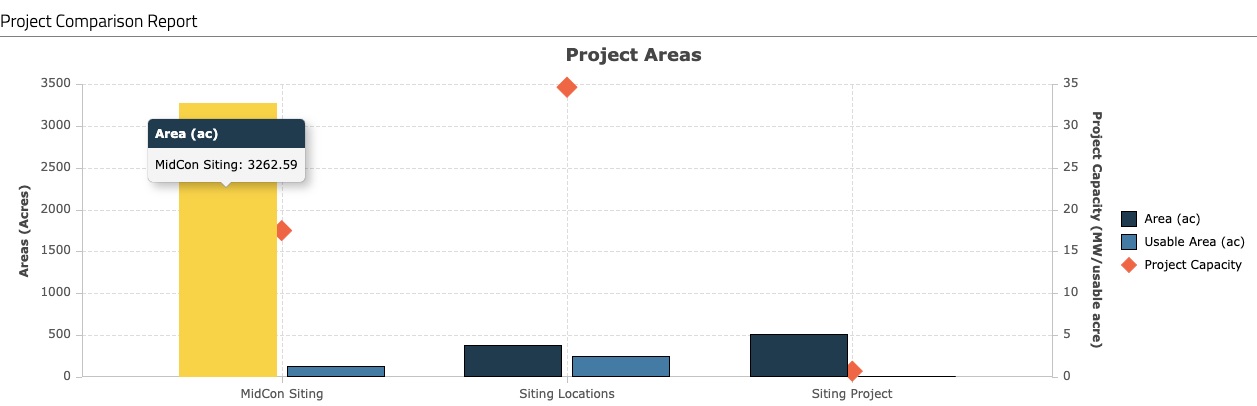
Hover over features on the graph to see their represented value.
Filtering, Sorting, and Downloading
Filtering
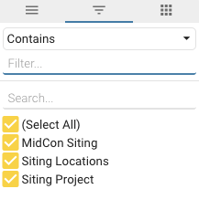
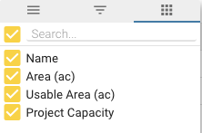
To filter on a column, hover over the column name until the hamburger icon appears to the right of the column name. Select the hamburger icon to open the filter menu. Choose the left option to change the table’s format. Choose the center filter option to begin filtering the data in the column. Choose the right option to edit what columns are shown in the table.
Sorting Columns
To sort the column, left-click on the column name. An arrow will appear to the right of the column name with the direction the column is sorted. To change the direction of the sort, place an additional left-click on the column name. To remove the column sort, place a third left-click on the column name.
Downloading Data
To download an Excel or CSV file of the Project Areas table, place a right-click anywhere on the table and select the Excel or CSV download.
Detail Report
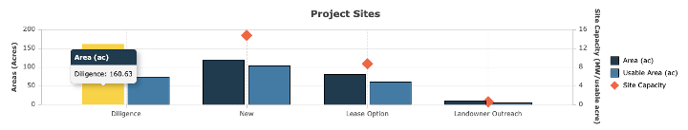
The Detailed Report provides a comprehensive analysis of a specific project and the corresponding sites it encompasses. The Project Sites graph displays each site categorized by project status, while the Siting Locations Site Detail table presents additional information about each site.
To access a Detail Report, simply select a project from the list of Detail Reports located on the left side of the screen.
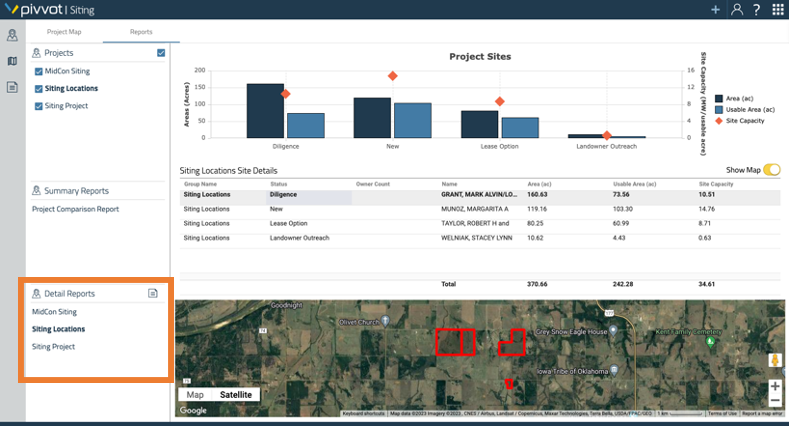
After selecting a project, the Project Sites graph and table will automatically populate with its data. You can hover over specific features on the graph to view their represented value.
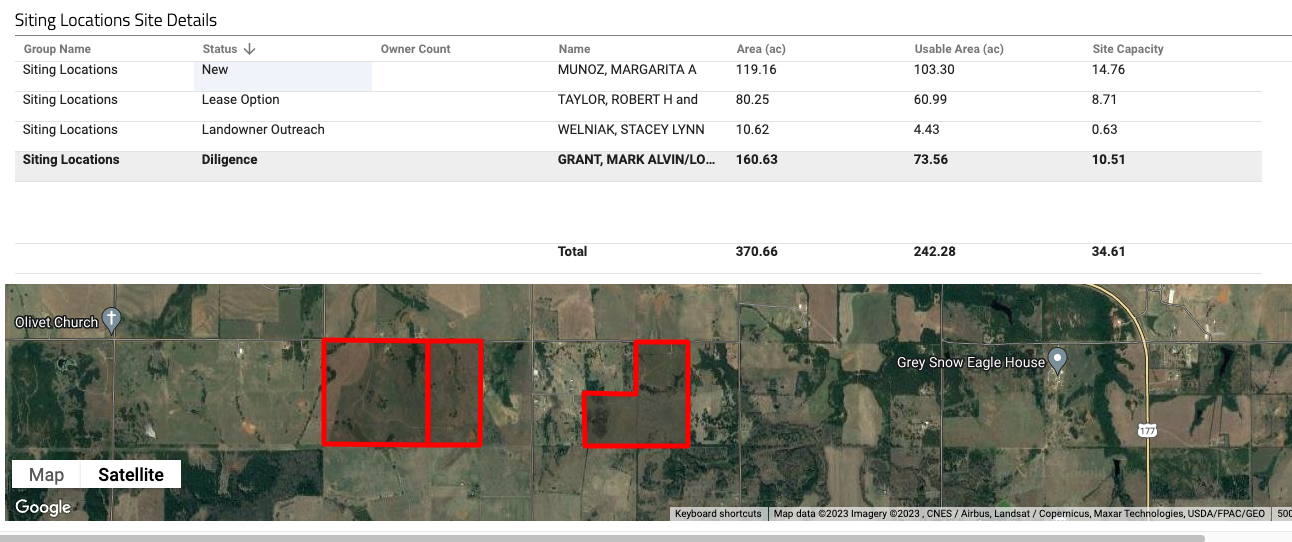
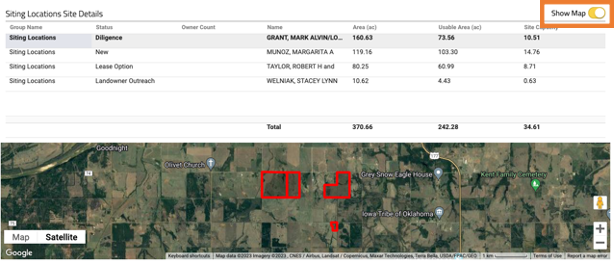
The Siting Locations Site Details table will display all values and their totals from the graph in a tabular format, along with additional columns such as Group Name, Status, Owner Count, Name, Area (in acres), Usable Area (in acres), and Site Capacity (in MW/usable acre).
To filter on a column, hover over the column name until the hamburger icon appears to the right of the column name. Select the hamburger icon to open the filter menu.
Choose the left option to change the table’s format.
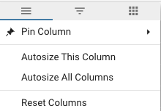
Choose the center filter option to begin filtering the data in the column.
Choose the right option to edit what columns are shown in the table.
To sort a column in the Siting Locations Site Detail table, simply left-click on the column name. An arrow will appear to the right of the column name, indicating the direction in which the column is sorted. To change the sort direction, left-click on the column name again. To remove the column sort, left-click on the column name a third time.
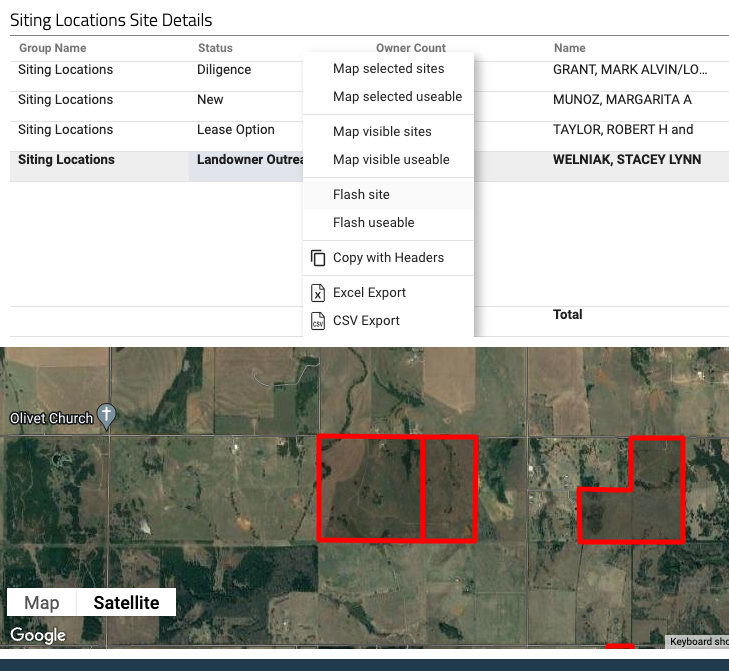
The Siting Locations Site Detail table includes a map that displays each site and its usable area. You can choose to view or hide the map by toggling the "Show Map" option located in the upper-right corner of the table. Note that using the map is optional.
To access additional functionality options in the Siting Locations Site Details table, simply right-click anywhere on the table. These options include the ability to map the project site boundaries or usable areas, as well as the option to flash the site boundaries or usable areas.
In addition, you can download an Excel or CSV file of the Siting Locations Site Details table by selecting either option from the right-click menu.
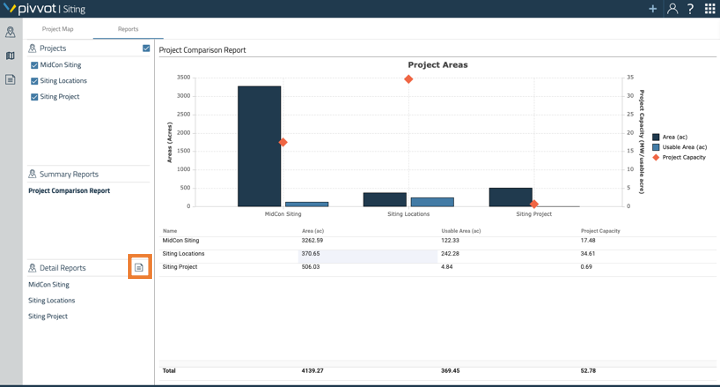
To download Details Reports to an Excel document, first select the project(s) that you want to include in the report from the Projects section of the Reports console. Then, follow the steps to generate the report and choose the option to download it as an Excel document.
After selecting the desired project(s) in the Reports console, click on the Download details icon. This will automatically start the download process, and the resulting file will be accessible in your browser.
If the download does not start automatically, please ensure that your browser's pop-up blocker is turned off while completing this process.
Related articles: