You are able to customize how a layer is displayed in the Pivvot platforms of Aware, Siting, and Map*.
The Map platform is available only to Pivvot Site View customers. Not all users have access.
There are two methods for styling a layer:
- Basic - Style all features the same. For example, all roads are displayed as black lines.
- Category - Style features based on a column attribute in the parent dataset. For example, private roads are displayed as black lines and public roads are displayed as red lines.
To access the Layer Style
- Select the Layer Console icon on the left sidebar within Publish.
- Search and locate the layer in the list.
- Right-click the layer > Edit Layer OR click on the layer > select Edit Layer icon at the top right.
- Select the Style tab.
Basic
The system defaults to the Basic style type. If the Basic style meets your needs, proceed to the Style Properties section below to customize the layer's style.

Category
To configure styles using the Category method:
- Select the Style type dropdown > select a column under the Category header.
To configure the style for each category value:
-
- Select on an item in the Preview window.
- Use "+" to add an item
- Select an item and use "-" to remove an item
- Select "
 " to give one Universal Style to all value
 - Select "
 " to add a Catch All, which is all values other than what you have already Styled
 - There are also icons for Clear and Refresh
- Select each item and Configure its style properties.
- Select on an item in the Preview window.
Style Properties
Style Properties for Basic and Category are the same with the exception that Category includes Column Operator and Column Value input boxes.
Column Operator (Category styles only)
1. Select the desired operator for value style. For most cases, the operator will be "EQUALS".
Column Value (Category styles only)
1. Confirm that the desired value displays in this box.
Legend label
The legend label is displayed in the Layers flyout within the Pivvot platforms (Aware, Siting, Map) when you expand a Layer to view its legend. It typically describes the feature.

To edit the Legend label
-
-
- Select in the Legend label input box.
- Type the desired value.
- Validate the value in the Preview window.
- Click the Save icon at the top right.
-
Display zoom level
The Max and Min Display zoom levels determine what zoom level a feature will appear / display on the map. Another way of putting this; is how close or far out am I until I see the features displayed.
For example, when you zoom out and can view the entirety of a state, you would not want parcel lines to display. At that zoom level, you will not be able to view any individual parcels. As such, you will likely want to set the Max Display zoom level for a dataset like parcels to "City" or closer. That means that the parcel dataset will not display until you zoom in to a city, or closer.
Conversely, you likely will want to set a dataset layer that has wide coverage, like a polygon showing a state boundary, to have a Min Display zoom level of "County" or higher, because if you zoom in closer than a county level, the state dataset layer will simply take up the whole screen.
Setting Max and Min Display zoom levels is very helpful in managing performance and the overall experience for the user. Performance can be slowed down by displaying too many layers at zoom levels the user would not require.
We have provided zoom level options ranging from:
-
- Building (features display when you are zoomed in very close on the map)
to
-
- Country (features display when you are zoomed out very far on the map)
To edit the Display zoom level
-
-
- Select the dropdown > pick a value.
- Click the Save icon at the top right.
-
Depending on whether your dataset is a point, line, or polygon layer will change the Style Properties available for you to adjust.
For example, point datasets will have an option to select Shape. Line datasets will have an option to select Width. Polygon datasets will have an option to select Fill.
The following Style Properties may differ / be available depending on the type of layer you are using.
Fill
You can customize the fill of a feature displayed on the map.
To edit the fill
-
-
- Select the dropdown > pick a value.
- Validate the shape in the Preview window.
- Click the Save icon at the top right.
-
Shape
You can customize the shape of the a feature displayed on the map.
To edit the shape
-
-
- Select the dropdown > pick a value.
- Validate the shape in the Preview window.
- Click the Save icon at the top right.
-
Width
You can customize the size of the features displayed on the map.
To edit the size of a feature
-
-
- Select in the Width input > type or toggle the value.
- Validate the shape in the Preview window.
- Click the Save icon at the top right.
-
The Preview has limits to the size of a feature it will display, however the true size will be displayed correctly in map.
Color
To adjust the color of your Layer
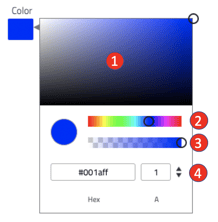
-
-
- Color gradient for chosen color.
- Color ramp. Modify this to change the primary color.
- Opacity - Slide the black circle to the desired opacity or enter a value between 0 and 1 in the A input box.
- Zero - The element is fully transparent (that is, invisible).
- Any number between zero and one -The element is translucent (that is, content behind the element can be seen).
- One - The element is fully opaque (visually solid).
- Color type - Click the up/down arrows to pick between Hex, RGB, HSL.
-
Border / Outline
You can add a border or outline around your shape.
To add a border or outline
-
-
- Select the Path/Shape dropdown > pick a value.
- Select a border/outline Width.
- Select a border/outline Color.
- Validate the changes in the Preview window.
- Click the Save icon at the top right.
-