Pivvot Data
Pivvot has added new gSSURGO datasets to our database. These layers were inspired by conversations with our customers. These layers include...
- gSSURGO Corrosivity Concrete
- gSSURGO Corrosivity Steel
- gSSURGO Depth to Bedrock
- gSSURGO Depth To Water
- gSSURGO Flood Frequency
- gSSURGO Prime Farmland
- Enhanced Karst Topography (Terracon)
To learn more about each of these datasets, please visit our Data Dictionary located in the help center.
Pivvot Siting
Polygon as Center Location (Previously Released)
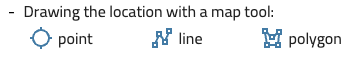
Pivvot has added the ability to draw a polygon on the map as a center location. This allows the user to draw custom boundaries in the areas that are of interest to them. This enhancement can be found on the Siting Criteria panel next to the point and line features.
Color Coding of Parcels and Their Associated Rankings (Previously Released)
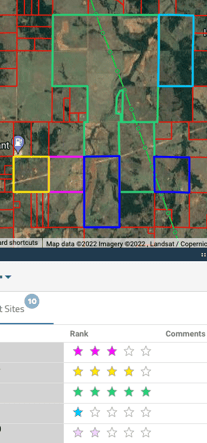
Pivvot now color coordinates parcels with their associated ranking. Each rank is given a specific color (5-Green, 4-Yellow, 3-Pink, 2-Lavender, 1-Cyan). The new color rankings allow the user to visually locate their highest ranked sites without having to sort through the project records.
AOI (New Feature)
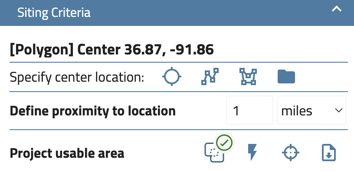
Pivvot's newest feature, AOI (Area of Interest), allows a user to draw geometry on the map, set a buffer and instantly calculate usable area. This feature allows for faster prospecting and eliminates the need to set up Siting Criteria. Once usable area is finished calculating, the user can then hand pick sites to add to their project based on the AOI's usable area.
Once the usable area is done calculating, the user can zoom to the usable area, flash the usable area or download a KML that contains the usale area, the site boundary, the buffer and all constraints.
This feature is located on the Siting Criteria panel.
Site Constraint Layers in the Layer Flyout (New Feature)
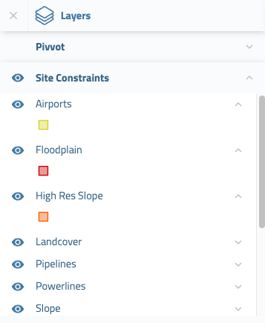
Pivvot has now added Site Constraint layers to the layer flyout in Siting. The new visual site constraint layers allow the user to analyze features that impact usable area and also give a heads up of what areas to avoid.
Customizing the Siting Report (New Feature)
Pivvot now allows users to customize the Siting Report by editing what Pivvot datasets to report on, choose custom map views of your projects site and its surroundings, and customization of the fields most important to you and your customers.
You will also be able to add your company's logo to the Siting Report to take your customization to the next level.
All edits to the Siting Report will be made in Publish.
To start editing the Siting Report visit Introduction to Customizing the Siting Report.
If you have any questions about these new updates, please reach out to support@pivvot.com.