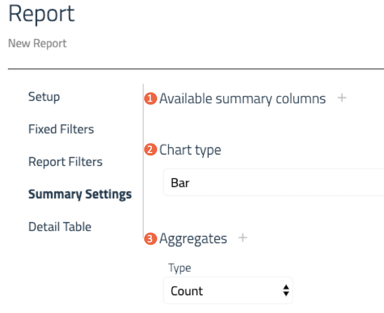
| 1. Available summary columns | Used to configure the Summarize by and Summary table sections of a report. |
| 2. Chart type | Choose between bar or pie chart. |
| 3. Aggregates | A summary of the report records. There are two types:
* Count - The total count for the records in the report. * Length - Summarizes the total length for all records in the report. |
See the sample Report illustration to get more context on what you are building.
A report can be configured to summarize using one or more columns. You can also add additional summarize by columns for the user to modify manually in the report. This section will configure the Summarize by and the Summary table sections of a report.
To configure the Summary sections:
- Click the Add Summary Columns button.
- Choose the column or columns you want to Summarize by. You can add as many columns as needed.
- Choose the column or columns you want to summarize by when the report is opened.
- Click the Save button at the top right.
Note: You can modify the order of the columns by dragging the column cards to a new location. To do this, left click the gripper icon and drag to the desired location.
Chart Type
You can configure the report to display either a bar or pie chart.
AggregatesTo configure an Aggregate
- Select Aggregates Type.
- To add additional aggregates, select Add Aggregate.
- If Length is chosen
- Select a numerical column containing a length value.
- Select Unit > add conversion if necessary.
- Click the Save button at the top right.
- Go to the Site View Console to Add a report to a Site View, then verify it is displayed correctly in Pivvot.