Report Content
Report content is broken into three different consoles for customization:
- Datasets- Choose which datasets you want reported on in the report.
- Settings- Customize each dataset with how it is displayed visually in the report
- Fields- Decide which attributes are displayed and how they are displayed in the data tables for each dataset.
Datasets
The datasets portion of the Report Content console allows you to select which datasets are reported on. To move a dataset, select a dataset and use the center arrows to move the dataset to the desired category. You may also left click and hold on the hamburger icon (three lines) to the left of each dataset to drag and drop into the opposite category or to modify their display order.
You can select the same dataset multiple times. Multiples will be indicated with a number to the right of the dataset name. (ex.  ) Datasets assigned multiple times will be displayed in separate pages of the report. This allows the user to customize each dataset with unique attributes.
To display datasets in alphabetical order, select the "Reset to display alphabetically" button located at the bottom left of the screen.
Click the Save icon at the top right of the Pivvot window.
Settings
The settings category allows a user to customize the look of the map that is included with each dataset as well as the look of the data table.
Customize Datasets
Each dataset can be configured separately or all datasets can be given the same configuration by toggling on the "Configure all datasets with the same config" option. 
To Customize Individually:
- Be sure that "configure all datasets with same config" is turned off
- To customize a dataset, select a dataset from the 'Report Datasets" dropdown.
- By default, a map is included. Toggle off to hide the map, if desired.
- Siting Reports will have a toggle for "Show usable area"
- Select the map type. Choices include terrain, hybrid, roadmap and satellite.
- Choose a scale for the map. Dynamic scale allows Pivvot to assign an appropriate scale to the feature. Static is a custom scale chosen by the user.
| Reference Scale | Static Value |
| Metropolitan Area | 10 |
| City | 11 |
| Town | 12 |
| Village or Suburb | 13 |
| ... | 14 |
| ... | 15 |
| Street | 16 |
| Block | 17 |
| ... | 18 |
| Street intersection | 19 |
| Building | 20 |
Show Table
By default, a data table in included with each dataset and will be located below the map in the report. To not include, toggle off.
Show Legend
By default the data table will include a map legend. To not include, toggle off.
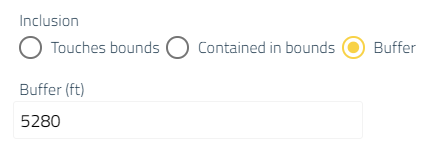
Inclusion
To only report on features inside the boundary of the parcel / project area, select Contained in bounds. To report on features in the parcel / project area as well as outside of the parcel / project area, select buffer and choose the amount of feet you want to buffer to cover.
Show Aggregate Data
Lastly, to show the aggregate (count, length, area, % coverage) in the data table, toggle on the Show Aggregate.
When this setting is used, if a dataset contains an aggregate field they will be visible in the Fields section.
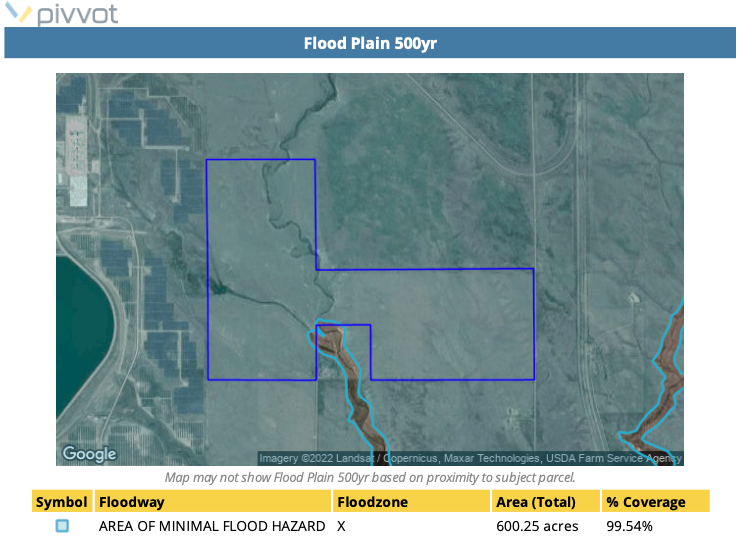
Show Feature Coverage Percentages (polygons only)
For Aware PDF reports, toggle on "Show feature coverage percentages" for the percentages to show in the data table for the dataset(s).
Click the Save icon at the top right of the Pivvot window.
Fields
The Fields category allows a user to customize what fields from a dataset they want included in the report and how they should display for each dataset.
1. First, select your dataset from the Report Dataset dropdown to get started.
2. Next, select a field to include in the report within the Available fields by placing a left click on it and using the center arrows to move the field to the Dataset fields. You may also left click and hold on the three lines to the left of each field to drag and drop into the opposite category or to modify their display order.
3. Once a field is moved to the "Dataset fields" it will also populate in the Label column below.
4. Once the field is populated in the Label column, the name can now be customized. Enter in the pixel width you would like of each column. 50 pixels is the minimum and 500 is the maximum. *Any text box that is grayed out is not customizable and has defaults set by Pivvot.
5. Select the check box if you would like the Fill used. This is to have your columns auto filled to the appropriate pixel width by Pivvot.
6. Finally, select the preview button to view what your configurations will look like in the report. Preview will display via a downloaded file to your computer's download folder.

7. Click the Save icon at the top right of the Pivvot window.